Experimental information
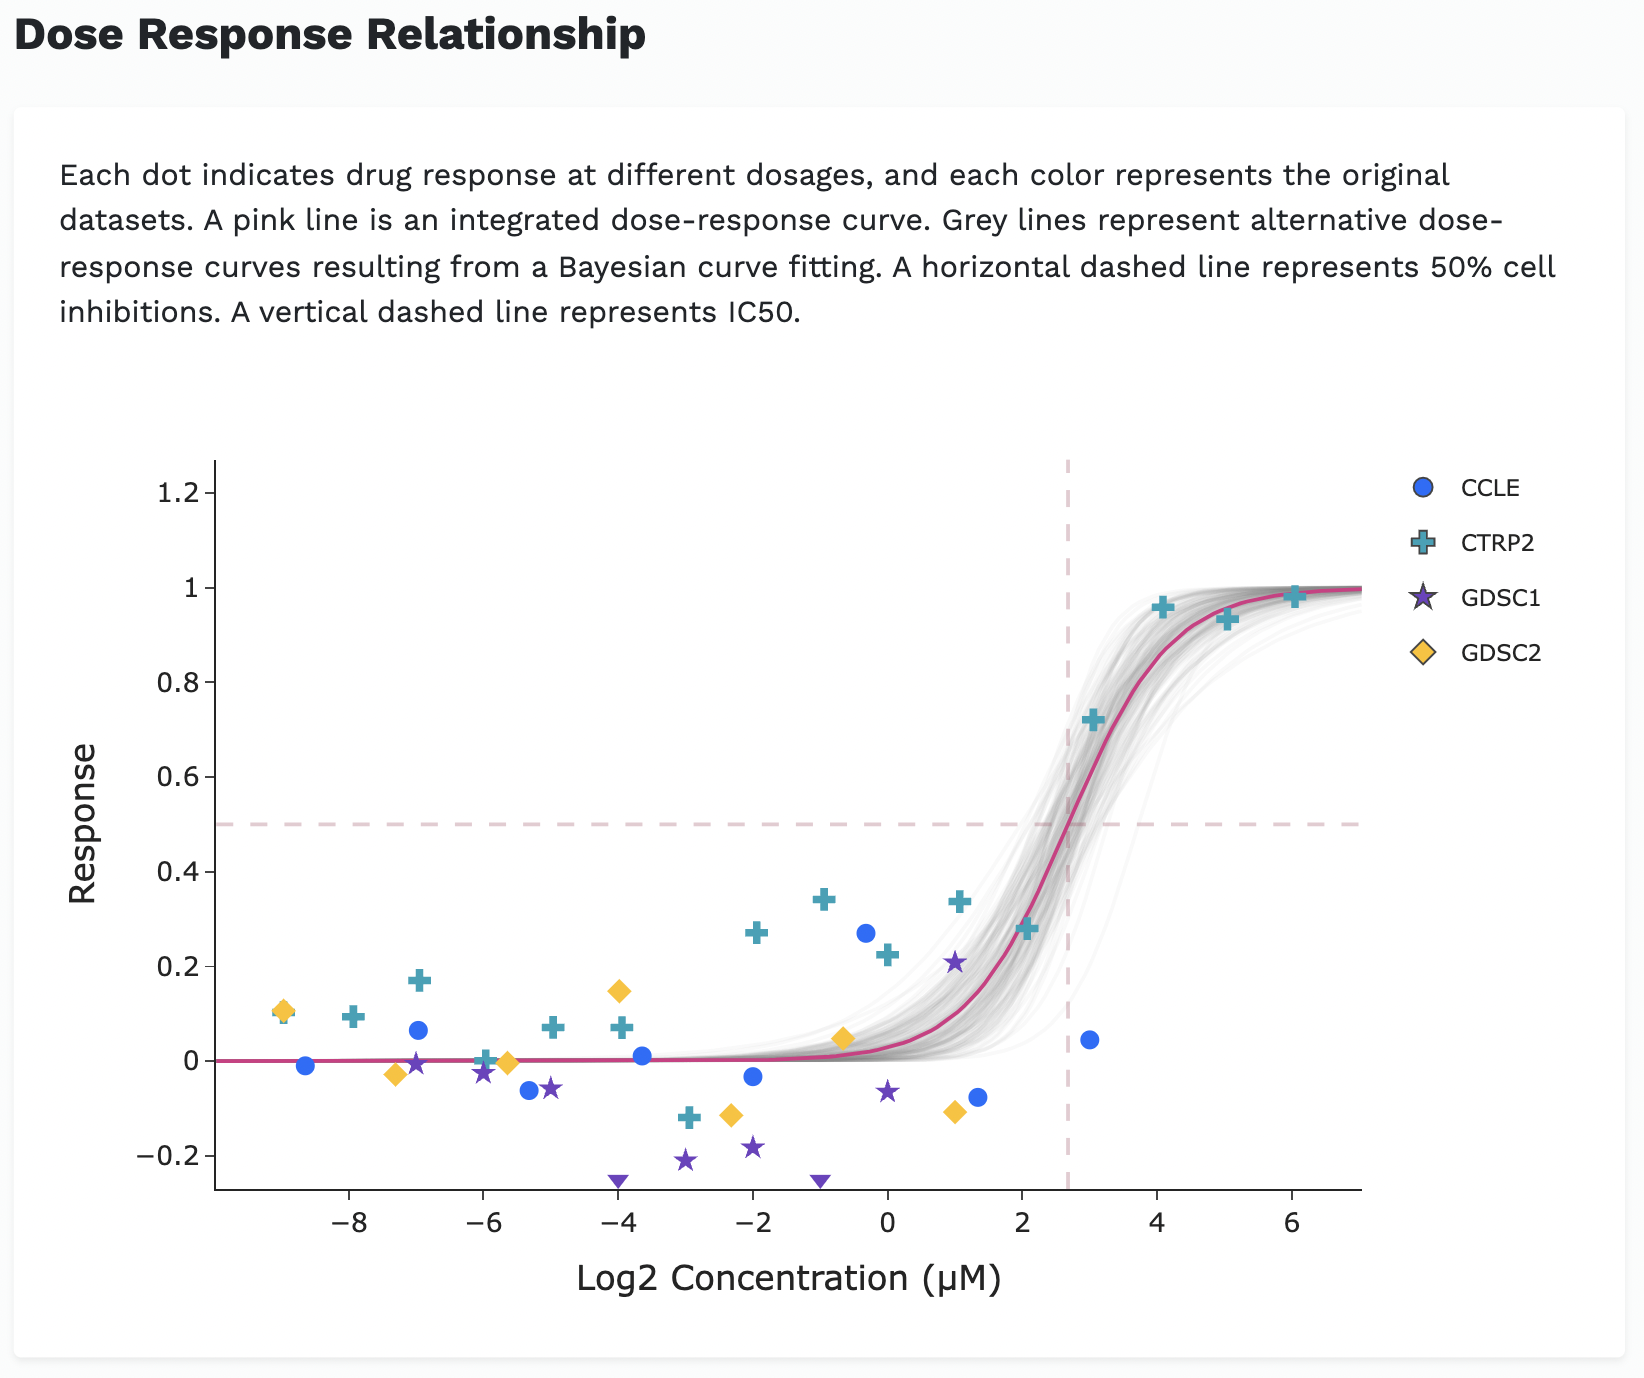
For the dose-response relationship, each dot indicates drug response at different dosages, and each color represents the original datasets. A pink line is an integrated dose-response curve. Grey lines represent alternative dose-response curves resulting from a Bayesian curve fitting. A horizontal dashed line represents 50% cell inhibitions. A vertical dashed line represents IC50.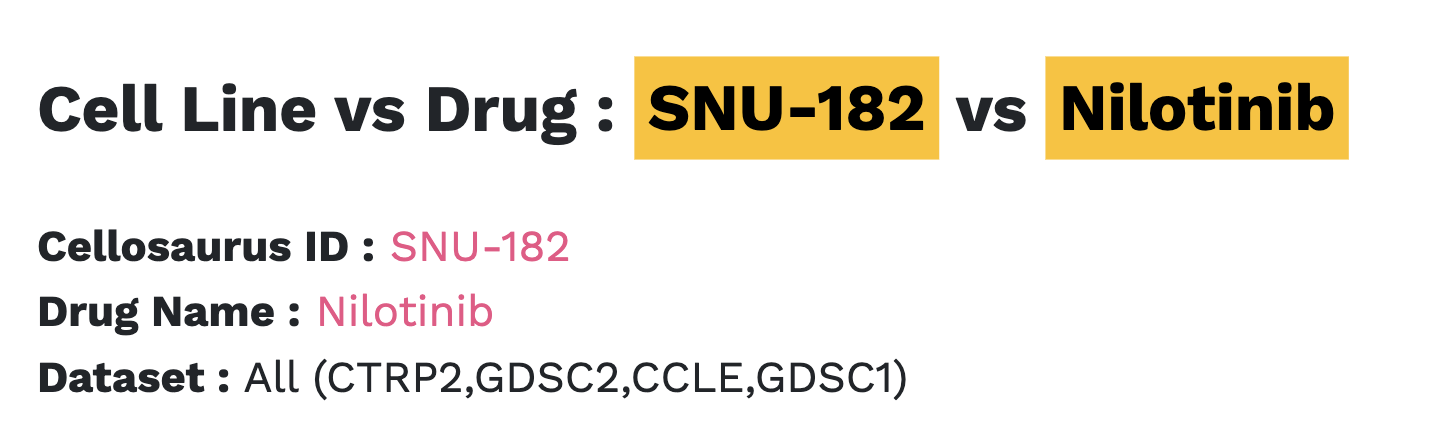
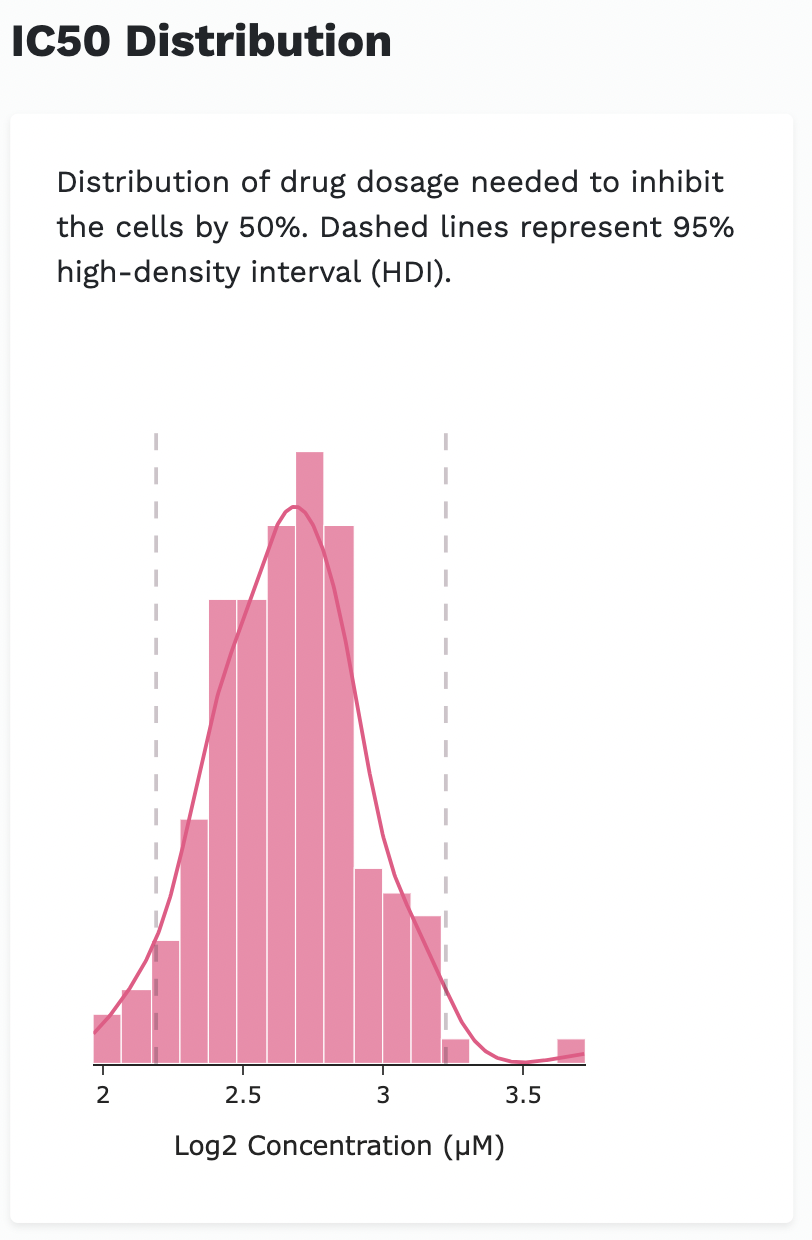
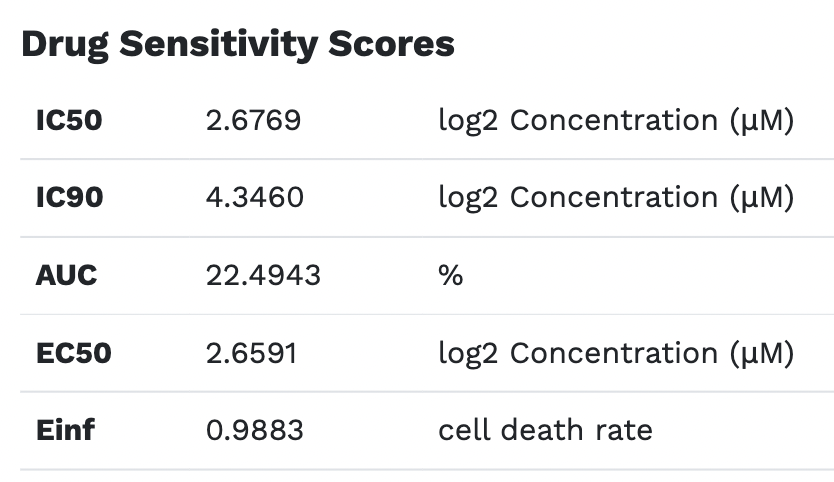
IC50 indicates drug concentration needed to inhibit the cells by 50%, in vitro, compared to the control well.
IC90 indicates drug concentration needed to inhibit the cells by 90%, in vitro, compared to the control well.
AUC represents the area under a dose-response curve, where 0% indicates no activity and 100% indicates that a drug completely inhibits the cells across testing dosages.
EC50 indicates half-maximal effective dosage, which induces a response halfway between the baseline and maximum inhibition.
Einf indicates the response at the highest drug dosage tested.
Dose-response curve fitting
Obtaining response information at different dosages
- CCLE dosage = dosage
- GDSC 1 and 2 neg control = NC-0
- CTRP 1 and 2 dosage = cpd_conc_umol
response = response × -0.01
pos control = B
dosage = conc
response = (neg_val-intensity) ÷ (neg_val-pos_val)
response = 1- cpd_avg_pv
A Bayesian curve fitting
- Logistic equation and parameter description \[f(x) = \displaystyle\frac{1}{1+2^{-k(x-a)}}\]
- We used JAGS to estimate a dose-response curve for each cell line. Initial parameters:
| Parameter | Value | Description |
|---|---|---|
| n_iter | 5000 | Number of samplings |
| burn_in | 500 | Burn in samplings |
| n_chain | 3 | Number of chains |
| k | dgamma(k_r, k_lambda) | A gamma distribution of slope |
| k_lambda | dnorm(2 , 0.01) | |
| k_r | dnorm(1 , 0.01) | |
| a | dnorm(a_mu , \((\frac{1}{a\_sigma})^2\) ) | A normal distribution of location (IC50) |
| a_mu | dnorm(0 , 1) | |
| a_sigma | dunif(0.01 , 5) | |
| f(x) | dt( \(\frac{1}{1+2^{-k(x-a)}}\) , \((\frac{1}{sigma})^2\) , nu) | A student's t-distribution of dose response curve fitting |
| nu | dnorm(250 , 0.001) | |
| sigma | dunif(0.01 , 0.1) |